
Welcome to the dataMine plugin for Vera
Note that this page is for UI4. For UI5, install the app through apps.mios.com, and see the PDF attachment that is attached to this page for more details.
Discussion here: http://forum.micasaverde.com/index.php?topic=7750.0
Overview of dataMine
dataMine is a plugin for logging selected UPnP variables to a file, and provides a frontend UI interface to allow graphing of the logged data. The graphing system supports interactive zooming and scrolling to allow the data to be manipulated as the user desires.
dataMine produces 3 history files to support different levels of zooming, and automatically chooses the correct level of data to display depending on the zoom level. When displaying the highest resolution data, the data is displayed down to the second, and when zoomed out, a subsampled dataset is displayed. The UI dynamically interacts with the user and Vera to display the most appropriate data at the time.
Installation
As dataMine makes use of a number of javascript libraries (primarily the flotr graphing package) installation isn't quite as straight forward as a standard plugin. The usual files (XML, JSON, LUA) are loaded in the normal way through the "developers" button in the control panel and all files specific to dataMine are placed into a directory /www/cmh/plugins/dataMine - this includes the js files, and a number of icons for buttons.
dataMine can generate a lot of data, so it is recommended to install a USB stick.
Click on MiOS developpers Go to the "Luup Files" tab and upload the following files -:
- L_DataMine1.lua
- D_DataMine1.xml
- S_DataMine1.xml
- I_DataMine1.xml
- D_DataMine1.json
- J_DataMine1.js
Go to the "Create Device" tab and set the following values-:
- UpnpDevFilename D_DataMine1.xml
- UpnpImplFilename I_DataMine1.xml
- DeviceType urn:schemas-cd-jackson-com:device:DataMine:1
- Description dataMine
Use WinSCP (or another SSH client) to upload the following files to Vera
Directory: /www/cmh/plugins/dataMine
- All the GIF/PNG/JS files (other than the files listed above)
Directory: /www/cmh/skins/default/icons
- Data_Mine.png
The plugin needs the json library. To install this, go to -:
and download this to the following directory on Vera
- /usr/lib/lua
Format a USB stick and mount it to the Vera. (I was unable to get the Vera USB log command to work.) I formatted my drive using FAT32 on my Windows 7 machine and it worked a treat.
- mkdir /dataMine
- mount /dev/scsi/host0/bus0/target0/lun0/part1 /dataMine
Modify (or generate if it doesn't exist) the /etc/init.d.custom-user-startup file to add the line -:
- mount /dev/scsi/host0/bus0/target0/lun0/part1 /dataMine &
Run the following commands -:
- chmod +x /etc/init.d/custom-user-startup
- /etc/init.d/custom-user-startup enable
This ensures the USB stick is remapped when Vera restarts. The second command makes the file executable, and the last command adds the symbolic link to start it on startup.
Once the dataMine device is running, click on the tool icon. You will get the graph tab, and config tab. Click on the config tab, and select the variables you want to log. All changes to the selected variables should now be logged to files in the /dataMine directory.
Use
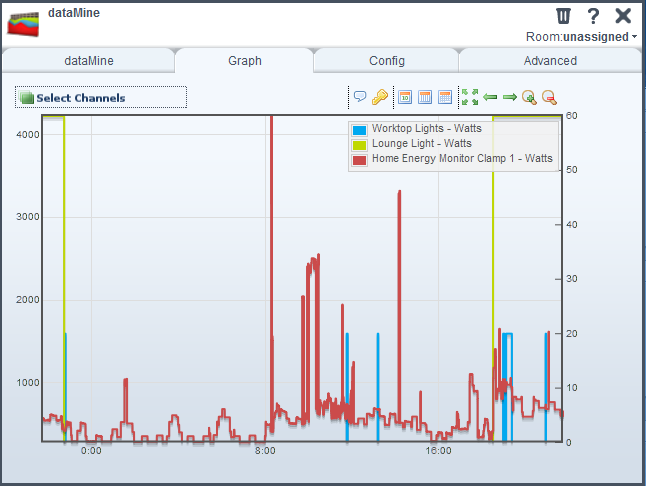
The dataMine plugin installs as a device, and by clicking on the tools button you are presented with two tabs. The first one is the graph tab. This has a "select channels" button to list all the available variables, and a number of buttons. The buttons allow you to enable/disable the mouse tracking and legend display, select the last day/week/month, or all data, and to scroll and zoom the data. You can also zoom by selecting an area of the graph with the mouse. If you put the mouse close to a data point, the datapoint will be highted with a red circle, and the time and value will be displayed in the bottom righ corner of the graph. (note that there is an issue here - the background UI needs to be scrolled to the top or the mouse position will be incorrect).

The following image shows a graph of non-numerical data. dataMine self learns a translation from the original text data to number that can be graphed.

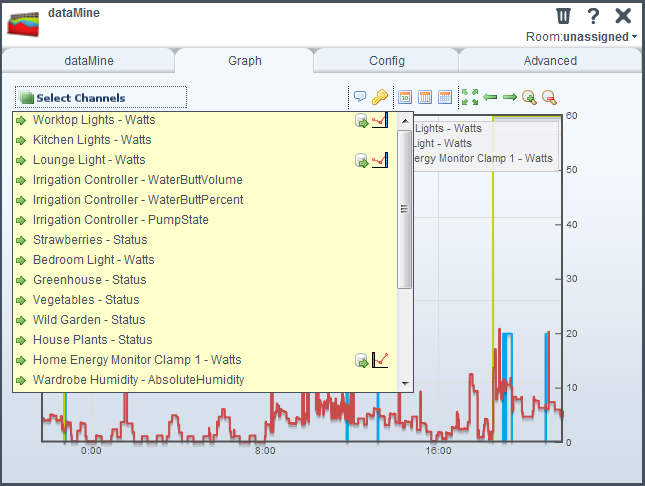
The following image shows the channel selection box. There are four fields of interest on each line. First, there's an arrow button. Pressing this will instantly graph this channel with no further action required. Next is the variable name. Clicking on this selects the channel, and enables two further buttons. The first button on the right is a "go" button - it will display all variables currently selected. The second button allows you to select two the left or right axis. This is extremely useful if you have different types of data (say, temperature and humidity) which would otherwise not graph well on the same scale.

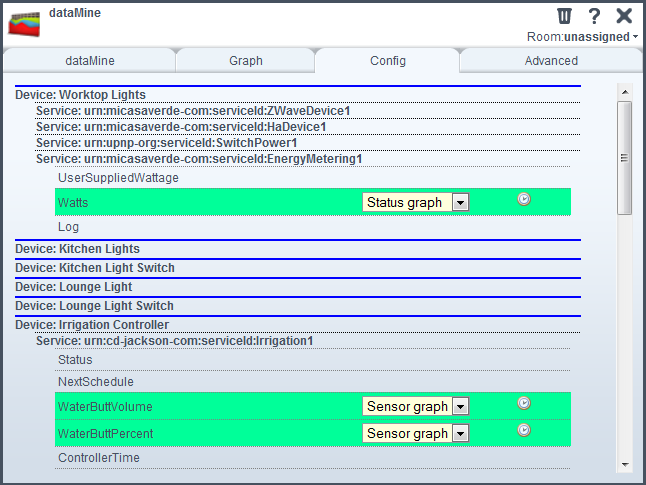
The config tab allows you to select the variables to log. This provides a list of all variables for devices that aren't hidden. Variables are listed by service, and if you click on the variable name, logging will be enabled. Clicking again will disable logging, but the variable will still be listed in the graph page dropdown. There's also a little clock button for selected variables. Clicking on this will generate the hourly/daily data for the different zoom levels (currently this is only manual, but it will be made automatic soon).
You can also select the graph type for each variable. Currently, this can be "Status graph" or "Sensor graph". For a status graph, all lines are horizontal - primarily designed for logging status type variables. For a sensor graph, lines are drawn directly from one point to the next.

Under the hood
dataMine records data in CSV files (Comma Separated Value). (Currently) three different files are generated for each variable being recorded - a raw, hourly and daily file. Files are then split to avoid them getting too large (which is a potential problem for constantly changing sensor data such as temperature). Each time Vera observes a change in the data for a monitored variable, dataMine will log the current value into a file. Each day, the long term history files are generated from the raw data.
Each line of data in the CSV logfiles includes two numbers - the time of the datapoint (as a unix timestamp), and the data value. For the raw file, the actual changes are logged. For the hourly and daily files, the minimum and maximum value and time are logged for each time period.
Attachments
- dataMine1.png (43.5 KB) - added by chris 14 years ago.
- dataMine3.png (52.4 KB) - added by chris 14 years ago.
- dataMine4.png (26.7 KB) - added by chris 13 years ago.
- dataMine-28-11-11.zip (74.2 KB) - added by chris 13 years ago.
- dataMine2.png (30.9 KB) - added by chris 13 years ago.
- dataMine - 18-01-12.zip (74.5 KB) - added by chris 13 years ago.
-
dataMine Overview.pdf
(849.1 KB) -
added by chris 12 years ago.
dataMine overview manual